Customer Churn Prediction for Subscription using spark

This is udacity’s capstone project, using spark to analyze user behavior data from music app Sparkify.
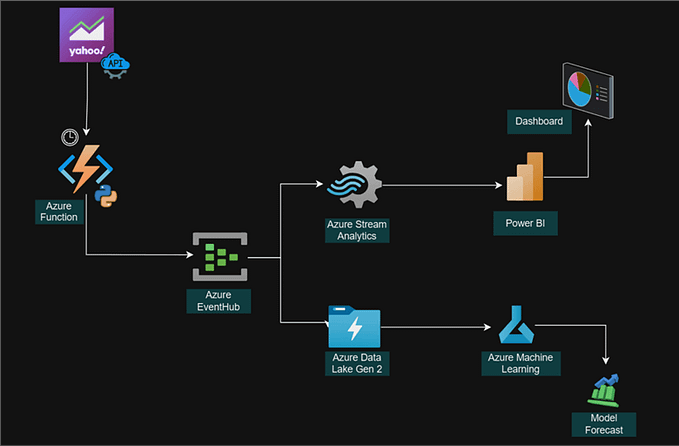
Project Overview
Sparkify is a music app, this data contains two months of sparkify customer behavior log. The log contains some basic information about the user as well as information about a single action. A user can contain many entries. In the data, a part of the user is churned, through the cancellation of the account behavior can be distinguished.
Problem Statement
The job of the project is to find the characteristics of churned users from the behavioral data of these users, and take measures to retain the potential lost users as early as possible.
The difficulty of the project is that the data handed to the model training should be one item for each person. While our data are behavioral data, we need to extract the user characteristics from the behavioral data, and then hand it to the model for training and get the results. These features will be generated from exploratory data analysis and feature engineering. In the case of poor results, the process may iterate many times until the model performs well.
Data Preprocessing
Behavioral data is different from the final training data, and we need to clean up some values that are not in our consideration. UserId and sessionId are keywords whose behavior is difficult to analyze if they are null, so the null value need to be removed.
There are some empty strings in the userId that may be actions of unregistered users from their browsing pages. These users are not related to this churn rate analysis, so they are also removed from the data.
Metrics
Since churn users is only a small part of all users, the model’s ability to identify churn cannot be measured by the accuracy. So recall rate is an important indicator. On the other hand, accuracy is an important indicator of the cost of retaining customers. Due to the the above goals, F1 is used as the measurement standard for training and evaluation.
Exploratory Data Analysis
First I’ve sorted out the meaning of all the columns
Artist: Composer
Auth: login status
firstName: first name
gender: gender
ItemInSession: operation sequence number of this session, from small to large according to time
lastName: surname
length: the length of the song
Level: whether the user is paid
location: the user location
method: method of getting web pages (put/get)
page: browse the page overview
registration: time stamp for registration point in time
sessionId: sessionId that should be used to determine a single login operation
song: song name
status: page return code (200/307/404)
ts: the timestamp of the log time
UserAgent: browse the client information
UserId: userId
I looked at all the page values, which recorded all the possible actions of the user. One things to confirm is Cancellation Confirmation, it means the churn users. And most of the rest of the operations are in the process of listening to the music. Downgrade related activities should also be very important for companies, but this Downgrade is not in our research range.
+--------------------+
|                page|
+--------------------+
|              Cancel|
|    Submit Downgrade|
|         Thumbs Down|
|                Home|
|           Downgrade|
|         Roll Advert|
|              Logout|
|       Save Settings|
|Cancellation Conf...|
|               About|
|            Settings|
|     Add to Playlist|
|          Add Friend|
|            NextSong|
|           Thumbs Up|
|                Help|
|             Upgrade|
|               Error|
|      Submit Upgrade|
+--------------------+
I first converted the timestamp to standard time for my observation and analysis. At the same time, all data periods were observed between October 1, 2018 and December 1, 2018.
+-------+-------------------+
|summary|               time|
+-------+-------------------+
|    min|2018-10-01 00:00:11|
|    max|2018-12-01 00:01:06|
+-------+-------------------+
I looked at the records of some of churn users. Free users often receive a Roll Advert, which can have an impact on the user. Downgrade pages are sent to subscribers regularly, which may also have an impact. However, a similar situation can be found when looking at non-lost user records, so the impact cannot be determined.
I then added the churn column to the dataset to mark churn users, so now I can observe the difference between what happens to churn users and what doesn’t.
The ratio of males to females is slightly different.

looking at the paid status of the churn users, it seems that the paid users account for a large proportion, and then we can add this feature to see if it helps the model.

This is the frequency of each page, I used the number of operations per 100 to analyze. You can see that the churn users Roll Advert frequency was significantly higher than the non-churn users. In addition, the two operations of Cancel and Cancel Confirmation are used to distinguish the churn users, so these two data cannot be analyzed by the user model and need to be removed before training the model.

The number of operations per session doesn’t seem to make much difference between the two groups.

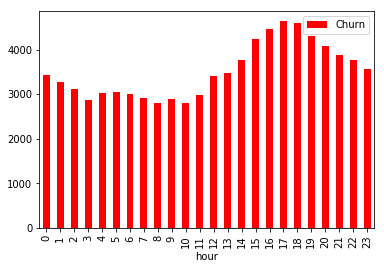
Finally, I checked the distribution of the two groups according to the time points of listening to the music. There were slight differences between the time and the week, and significant differences between the time points of the month. The difference in monthly time points may be due to the uniform distribution of user churn, resulting in fewer users at the end of the month.


Feature Engineering
The selection of features is based in part on user characteristics, including gender, registration time, whether paid, and how many singers have been heard.
Some are based on behavioral data. The selection of behavioral data is mostly based on the session of each user, including the statistical value of listening time of each session, the number of listening songs in each session, and the number of sessions.
The final count is the number of pages per 50 views.I generated a dataframe for each feature separately, and finally made all features into a dataframe for the final training model by left linking.
Training , Metrics and Tuning
Our problem is to predict which users that are likely to churn which not, so essentially this is binary classification.
First, I create some function for implement different machine learning in easy way or moduler. Second , confirmed the skew of data distribution. Data skew affects not only our metrics, but also our results, as we’ll see later.
Before spark training the model, it was necessary to put all the features into vectors. When putting data into vectors, I found that many of my features were string types, so I have to convert them to float.
Although it does not affect the tree model, standardization is important for linear models. I decided to standardize the data.
I use linear model and tree model for training, including logistic model, decision tree and GBT. I select the model with the best performance, divide the test set using 3-fold cross validation and grid search to determine the model parameters for the training set. Finally I use the validation set to evaluate the model performance.
The Logistic Regression model
Fitting in progress... Done in 2 minute(s) and 6.3 second(s)

Saving the model as LogisticRegression.model... Done in 1.51 second(s)Training (Accuracy = 88.14%)       Testing (Accuracy = 75.00%)
Logistic regression’s hyper-parameters includes elastic network parameters and regularization parameters. This is mainly based on the different regularization effects.
The detailed hyper-parameters are configured as follows:
model = LogisticRegression()param_grid = ParamGridBuilder() \
    .addGrid(model.regParam,[0.01, 0.1]) \
    .addGrid(model.elasticNetParam,[0.0, 0.5]) \
    .addGrid(model.aggregationDepth,[2, 5]) \
    .build()m = model_fitting(train, model, param_grid,
'LogisticRegression.model')# Model metrics
display(get_formated_metrics(m, test))
# Features effect
draw_features_contribution(m, x_labels=features_labels)
the result or prediction of Logistic Regression model given in below figure

The Decision Tree Classifier model
Decision tree’s hyper-parameters includes impurity and maximum depth. The detailed hyper-parameters are configured as follows:
model = DecisionTreeClassifier()
param_grid = ParamGridBuilder() \
    .addGrid(model.maxDepth,[3, 5, 10]) \
    .addGrid(model.impurity,['entropy', 'gini']) \
    .build()the result or prediction of DecisionTreevClassifier model given in below figure

The Gradient-Boosted Trees (GBTs) model
GBT’s hyper-parameters includes max iterations and maximum depth. They are all for the overfitting case.The detailed hyper-parameters are configured as follows:
param_grid = ParamGridBuilder() \
    .addGrid(model.maxDepth,[3, 5, 10]) \
    .addGrid(model.maxBins ,[10, 5]) \
    .addGrid(model.maxIter ,[20, 5]) \
    .build()the result or prediction of DecisionTreevClassifier model given in below figure

The Random Forest model
model = RandomForestClassifier()param_grid = ParamGridBuilder() \
    .addGrid(model.maxDepth,[5, 10]) \
    .addGrid(model.impurity,['entropy', 'gini']) \
    .addGrid(model.maxBins ,[10, 5]) \
    .addGrid(model.numTrees ,[20, 10]) \
    .addGrid(model.featureSubsetStrategy ,['sqrt', 'onethird']) \
    .build()m = model_fitting(train, model, param_grid, 'RandomForestClassifier.model')

Result
The result is not ideal, the recall rate of the model is very low, even the recall rate of the tree model is 0. I decided to undersample the training data, balance the categories of the training set to increase the recall rate and improve f1.
The best model is Random Forest model. According to the results of the model, it is the frequency of Thumbs Down that has the greatest impact. Churn users have more Thumbs Down. Naturally, users will leave if they are not satisfied.
Conclusion
In this project, I implemented a model to predict customer churn for Sparkify music streaming services. I explore the data set to get some ideas of what features might be useful and create features for the modeling process. Here I evaluate 4 models:Logistic Regression model, Random Forest (RF), Gradient Boosted Trees (GBT), and Decision Tree Classifier model .
                  Train       Test
Accuracy       0.915254       0.750000
Precision      0.961538       0.666667
Recall         0.641026       0.153846
F-Score        0.769231       0.250000Random Forest (RF) result
The tuned RF model is able to achieve about F1 score 0.76, which still outperforms the baseline model — predicting everyone not churn, with F1 score of 0.25, though its performance is actually inflated due to the imbalance of data set. Based on F1 score, the final model has 9% improvement compared to the baseline model.
The features can also be improved if considering more factors or adding more domain knowledge. It evolves as the company grows its user base and excavates more insights from data.
For more details about this project, please check my Github available here.